
When considering knee or joint replacement surgery, you naturally want to know: will this implant last? What are my chances of needing revision surgery? These questions are answered by the National Joint Registry (NJR), a comprehensive database tracking every joint replacement performed across the UK. The NJR provides transparency about surgical outcomes, implant longevity, and revision rates across thousands of surgeons.
As a Consultant Orthopaedic Surgeon performing knee replacement procedures at The Avon Orthopaedic Centre, Spire Bristol, and Nuffield Hospital Bristol I have UK National Joint Registry results that are currently amongst the best for implant survival and revision rates in the UK. This is also with a patient demographic of a higher average Body Mass Index (BMI) and higher risk anaesthetic scores (ASA).
Understanding the National Joint Registry
The National Joint Registry is a database operated by NHS England recording detailed information about every hip, knee, ankle, and shoulder replacement performed in the UK. Since its inception in 2003, the NJR has tracked over 3 million joint procedures, offering a wealth of data regarding surgical performance and patient outcomes.
Every NHS and private hospital submits data on each joint replacement, including patient demographics, implant details, surgeon information, and, most importantly, long-term outcomes. Patients are followed up periodically, through postal questionnaires or online surveys, asking about implant function, pain levels, satisfaction, and whether they’ve required further surgery. This real-world follow-up data extends beyond 10 years, providing long-term outcome information unavailable from most registries.
This comprehensive data allows for unprecedented comparison of surgical outcomes between surgeons, hospitals, and implant manufacturers. The NJR publishes annual reports comparing revision rates, complication rates, and patient satisfaction across the UK, aiding patients in making informed decisions.
What Revision Rates Mean
A revision is a second operation replacing a failed implant. Common reasons include implant loosening, wear, infection, or recurrent instability. An implant lasting 15 years or more without revision is considered highly successful. According to the NJR, national average revision rates for total knee replacement sit around 7-10% at 10 years, indicating the importance of choosing a skilled surgeon.
“Implant survival” refers to the percentage of implants still functioning at specific time points, typically 5, 10, and 15 years after the initial operation. For example, 95% survival at 10 years means 95% of patients haven’t required revision surgery, underscoring the significance of surgical expertise.
Revision rates vary significantly among surgeons. National average revision rates for unicompartmental knee replacement at 10 years range from 10-15%. For total knee replacement, national averages sit around 7-10%, emphasising the need for patients to evaluate their surgeon’s NJR results before proceeding.
Why Revision Rates Vary
Multiple factors influence revision rates: surgeon experience, case selection, implant choice, surgical technique, and postoperative patient care all matter substantially. A surgeon who carefully selects appropriate candidates tends to have lower revision rates. A surgeon who performs a high volume maintains expertise through repetition. One who emphasises postoperative rehabilitation and follow-up identifies problems early.
My approach emphasises rigorous patient selection, meticulous surgical technique, and comprehensive postoperative care. These principles directly translate to lower revision rates and improved patient outcomes.
My National Joint Registry Results: Exceptional Outcomes
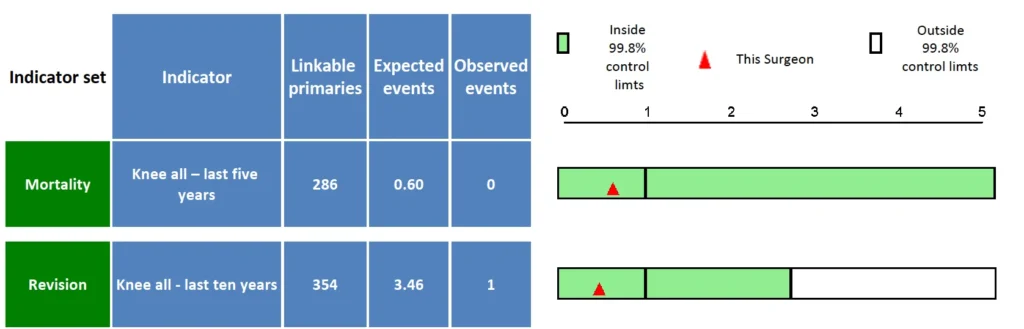
My National Joint Registry data demonstrates consistently exceptional outcomes compared to national benchmarks. Over the 12-month period from April 2025 to March 2026, my patient outcomes significantly exceed what would be statistically expected.
The Specific Data: What the Numbers Show
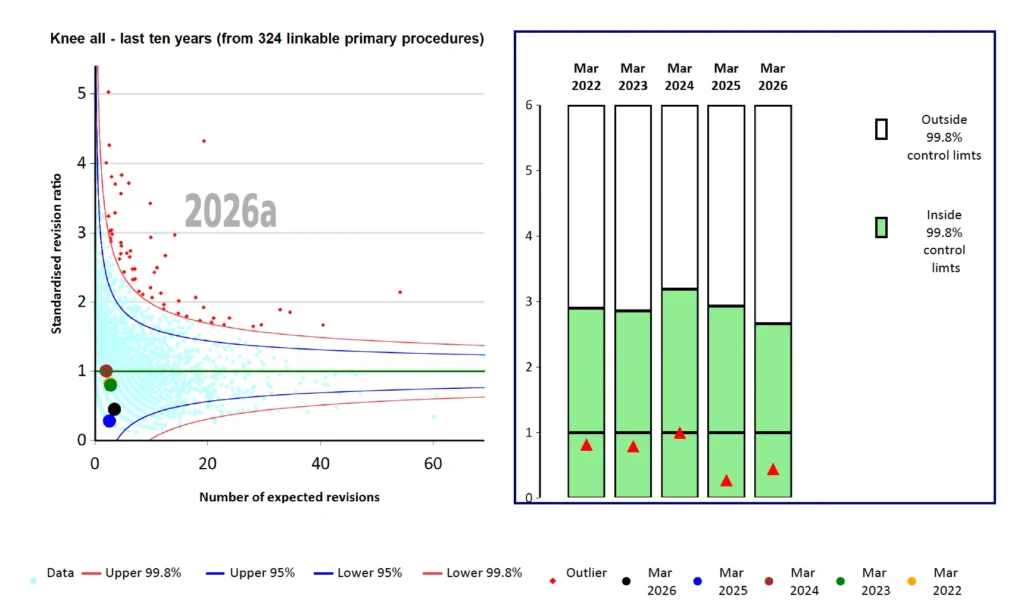
Revision Performance: My 10-year knee replacement data is based on 324 linkable primary procedures. The NJR expected 3.46 revisions based on patient demographics, case complexity, and national benchmarks. However, I recorded only 1 revision during this period.
This means my revision rate is just 29% of the statistically expected rate. My patients have less than one-third the revision risk compared to what would be anticipated nationally, showcasing the impact of my surgical approach.
Mortality Outcomes: My data shows zero procedure-related deaths across 286 linkable primary procedures over five years, compared to 0.60 deaths expected. This demonstrates exceptional perioperative safety, a crucial factor for patient peace of mind.
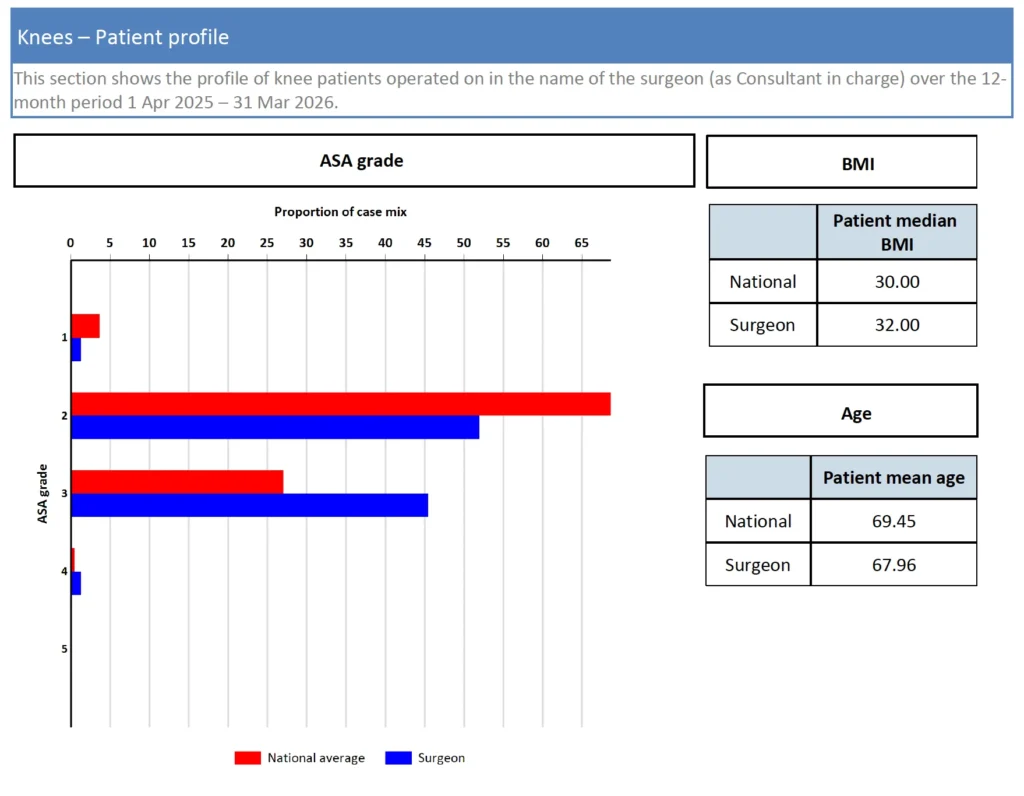
Patient Profile: My patient cohort shows slightly higher complexity than national averages, patients are slightly younger (mean age 67.96 versus national 69.45) and have marginally higher body mass index (32.00 versus national 30.00). I have more patients than average with serious medical conditions such as heart, lung or kidney disease (46% ASA 3 versus 27% ASA 3 national average). Despite operating on this more complex population, my outcomes remain exceptional.
Sustained Excellence: My consistent performance across 324 procedures tracked from March 2022 through March 2026 remains consistently better than expected levels; sustained, systematic surgical excellence.
What Contributes to These Exceptional Results?
Several factors contribute to my superior NJR outcomes:
Rigorous Patient Selection: I carefully evaluate whether individual patients truly benefit from joint replacement. Some patients fare better with conservative management, whilst others are ideal candidates. This selective approach means I operate on patients most likely to have excellent outcomes.
Surgical Technique: Decades of experience performing joint replacements enable precision implant positioning and soft tissue handling. Small variations in technique significantly influence implant longevity. My surgical approach prioritises infection reduction.
Implant Selection: I choose implants based on long-term NJR data demonstrating superior performance. Rather than adopting every new design, I select proven implants with established track records.
Comprehensive Postoperative Care: My commitment to thorough postoperative follow-up identifies complications early. Regular monitoring catches loosening, wear, or infection when intervention can prevent revision surgery.
Research-Driven Practice: My involvement in joint replacement research ensures my practice remains evidence-based. I continuously evaluate latest data and modify my approach when evidence supports improvement.
What These Results Mean for Your Surgery
You benefit from evidence demonstrating exceptional outcomes. Based on NJR data, you have:
- Low risk of implant failure
- Low likelihood of requiring revision surgery
- High probability of maintaining implant function long-term
- Excellent chance of maintaining pain relief and mobility years after surgery
NJR results reflect my commitment to individual patient assessment, meticulous surgical technique, careful implant selection based on rigorous outcome data, and comprehensive postoperative rehabilitation, ensuring early intervention if problems develop.
Conclusion
The National Joint Registry provides unprecedented transparency about joint replacement outcomes. This data should inform your surgeon selection, particularly for major procedures where success depends significantly on surgical expertise.
My National Joint Registry results demonstrate exceptional outcomes reflecting decades of commitment to surgical excellence, rigorous patient selection, and evidence-based practice. Your joint replacement surgery deserves this level of expertise and demonstrated track record.
When you’re ready to discuss your joint replacement options and understand how NJR data supports your surgical planning, book a consultation with me at Bristol Royal Infirmary or Spire Bristol Hospital. Together, we’ll review your specific situation and ensure you receive surgery from someone with proven, documented exceptional outcomes.
Frequently Asked Questions
What is the National Joint Registry and why does it matter?
The NJR tracks every joint replacement in the UK, recording outcomes including revision rates and implant survival. This provides objective evidence of surgical results, allowing patients to compare surgeons based on verified data rather than claims alone.
What do revision rates mean in practical terms?
A revision is replacement of a failed implant. My NJR data shows I achieved 1 revision when 3.46 were statistically expected, meaning my patients have approximately 71% lower revision risk than anticipated, reflecting superior surgical technique and postoperative care.
Why are my surgeon's NJR results important?
Superior NJR results demonstrate that a surgeon consistently achieves excellent patient outcomes. This objective data shows you have lower risk of implant failure, better long-term function, and reduced likelihood of requiring future revision surgery.
How can I access my surgeon's NJR data?
The National Joint Registry publishes annual reports comparing revision rates between surgeons and hospitals. Surgeons should openly discuss their specific NJR results with patients. If a surgeon refuses or avoids discussing this data, consider this a red flag.
What specifically do Mr Putnis's NJR results show?
My published NJR data across 324 knee replacement procedures shows: 1 observed revision when 3.46 were expected (71% below expected rate), zero procedure-related deaths, and consistent performance within control limits across 4+ years. This demonstrates sustained surgical excellence with exceptional patient safety.
